Chapter 1. Introduction of Impact of Risk Management
on Industrial Productivity
1.1 General Introduction
of Impact of Risk Management on Industrial Productivity
Risk management
basically the process is to investigate and assess the controlling the risk
factors of the which have been occurred within the enterprises. These
hazards and mishaps would be obtained from a wide variety of resources that
contain legal abilities, errors in strategic management, financial
uncertainties and some natural hazards as well. Some of the security threats
have also been found in the organization which is associated with the threats
to data. To avoid such kind of hazards it is necessary to plane a risk
management system within the organization to avoid all types of threats from
the company.
As we all know that the world of the
business is changing continuously. This is impulsive, volatile and as well as
fought with these risks. For this purpose, risk management and his assessment
give the apparatus to investigate some of the representing opportunities which
present the potential dangers. Every company has faced some challenges which
are related to the threats in the success of the company. The probability of
risk factors is mainly associated with the consequences of an event. (Romero, 2018) Moreover, risk
management has been known as the tool or method which provide different
resources to manage and avoid these kinds of risk from the industry.
Companies who have been facing such challenges may give a
positive or negative impact on the productivity of the company.
Events which gives negative influence
to prevent and corrode the existing value. The excellent plan of risk
management would be helpful for the company for the development of the process
to avoid the potential threats as well as to decrease the impact of the which
maybe occur to cope up with the findings. The capability to cope up with the
risk of control which gives permission to the company to feel more confident
while making decisions for their company. Despite this potent governance
factors emphasized mainly on the management of risk to meet the goals.
The essential of the study is to
develop a safe and secure working atmosphere for all the employees and
consumers. As well as to enhance the consistency among the operations of the
and on the other side to minimize the legal responsibility (Malik, 2019). This will also give
protection from the various incidents that have been obtained from both the
environment and the company. Furthermore, this will also be helpful for the
accomplishment of the insurance requirement of the enterprises for the purpose
to save the uneven premiers. Some procedures have also been included within the
company to find some plans while taking some steps to meet the risk management
process generally.
In this paragraph, we will discuss some
of the industrial companies that were facing these problems. In Business risk management,
these types of risks mainly deal with the prospects which are influencing
various events of the company. To avoid these kinds of events we have to use
such kind of strategic procedures should be included within the organization.
All the hazards likely to disturb the establishment which would lead them for
better presentation and inexpensive benefit, especially when threats and intimidations
are acknowledged, (Almeida, 2017) and the perils
evaluated and meticulous, in the same way as for openings and booties. To
develop the influential management system and all of its parts which has been
contributing including all the approaches within the company. Senior managers
of any organization have been found out the level of risk in the company who
are willing to take this. They rapid their jeopardy craving in
existing relations such as salary unpredictability and
probable fatalities of investment, impartiality or resources.
Some of the semiconductor companies
have been categorized by the critical and expensive industrial procedures which
have been continued with the creation of innovative technologies. While the invention
of the cycling instruments some failure and breakdown effect the quality of the
productivity and maintenance effect which is associated with the effect on the
active control on the developmental procedure. (Naji, 2019) Some documents have
also been given to the consumer in order to give the main and probable threats
according to the control of the action plans. Furthermore, the applications of
the method of FMECA which is quite time-consuming. This method asks clients about
the consumers and for the workers who are employed hardly and
operationally. The study also suggested
a method of FMECA to utilize this as a tool that enhances the productivity of
various areas of the organizations. The study also reveals the possible
outcomes of the method along with the energetic atmosphere. This method also
brings constant up-gradation by the operational incidents.
Crises that have been occurring within
the company are damage to stick, fire, illness and all the other critical situations
which can make it difficult for the staff to handle such kind of situations
which are diverse from the daily routine. Despite this, we can easily be fought
with such kind of situations. As well as it has been observed that after having
these situations a company may lose his clients. But the company has also been
come up with this by doing some plans related to crisis management. (Andersen, 2019)It is important to
have some backup plan to cope up with such types of natural hazards. We have to
take some steps such as first the organization has to investigate the effects
of the crises. Then find out the reason that how one will decrease the threats
which are related to the occurrence of the disasters. Then discuss how to handle
and cope up and react against the disasters within the business for the
continuity of the plan, and in the last one thing that has to be done is
testing the regulatory of the plan. This has been explained through an example:
if anyone is contingent on the computer information and one should have to give
a back-up plan as well as a copy of the data within the system which is related
to the failure of the event.
Here we discussed some benefits that
have been obtained from the continuity of the plan is the carefully coping up
with the continuity of the plan which makes it easier for the staff to handle
the situation and minimize the risks of the business and clients as well. (Sadgrove, 2016)As well as we will
also explain the crises which pay effect on the business such as natural
disasters: suppose that flooding has been caused by the bloom in water
pipes or with the leakage in the due to heavy rain or which may be caused by
the wind damage due to heavy storms. Theft or defacement: this is mainly
related to the theft of the computer tools for some time and as well as the
destruction of vehicles and equipment which is not expensive but this will also
be postured for the risk of safety and health. Terrorist attack: some
threats have also been mentioned the threats which are related to terrorist
attack for the employees and operations of the business if there is any
terrorist attack. This can be happening when your business has been based on
the area where the staff can travel easily. It can also be considered that
whenever an attack has occurred this will last the effect on a long-term basis
including the market and public sector. Fire: some of the situations can
also be considered the which is related to the attack of the fire which can
destroy the business physically. Failure of IT system: some of the
crises has also be seen in the phase of attack of viruses on the system of
computer as well as some attacks from the hackers which mainly affects the
capability of clients.
There were some probabilities and
consequences also found which may affect the business. For this purpose, there
were some analysis has been mentioned which will help to find out the
significance of the business operations. (Tupa, 2017) As well as it has
been concluded that there were some roles that have been presented which is
required in normal situations. The risk of having disasters has occurred on the
probability which has been measured on a statistical scale with high, medium
and low frequencies.
1.1.1 Ways to handle issues of Impact of Risk
Management on Industrial Productivity
Here we defined some procedures to
solve the issues along with the framework of handling the risk in different
ways and these some ways are such as avoiding the risk factors within the
organization. The below we will discuss how we put this in our business. The
initial step we have to take is making a strong management plan which mainly
depends on the requirements of the company. Then after the risk has been
identified then assessment related to the probability should be done. After
this initially done the insurance and safety for managing the risk. As the risk
of fire has been mention above then we have to make insurance of fire as it was
necessary for the business which acquires the physical space whether it is
owned or rented. As well as it is significant for the product accountability
insurance which is the obvious example and this is the requirement for the
services of the business.
Some of the risks have also been
mention as the top priority the hazard of fraud and appropriation where workers
knob money or accomplish office duties in financial records owed and
receivable. Despite form this protection against the strength of risks which
will never be supposed as to be the best scenario for the case. (van Winsen, 2016)This can also be
taken for the workers who have been working in the company for many years along
with no problem with the service, and this is the error that is against the
employment of the. The degree to which the protection of insurance against the
injury of any accident will be relay upon the nature of the business. A plant
that mainly deals with strong production would obviously need the wider
attention of the workers.
Moreover, risk prevention is another
excellent insurance. Prevention from many risks has been obtained from the
business and this is highly accomplished by the training of the workers who are
working in the company. As well as by checking the safety measures, checking
background, maintenance of mechanism and instruments on a daily basis. Furthermore,
the responsible member of staff who has authoritative qualities would be
appointed which tackles all the responsibilities which are mainly associated
with risk management.
Despite form, the above description members must get aware
of all the exit points of the business and all the ways of emergency (Picci, 2019). A proposal for the
security examination of the corporeal locations and apparatus would be
established and instigated habitually counting the training and edification of
employees when required. An intermittent, rigorous evaluation of all probable
risks would be directed. Any complications would be addressed immediately.
Assurance exposure will also be reviewed intermittently and elevated or
relegated as needed.
1.1.2 Risk management improve productivity in terms
Some risk management has been used to
improve productivity such as the assessment of the safety risk. As well as the
main aim of the safety risk management is to evaluate and investigate the
threats which have been effectively applied along with the proper mitigation.
This is the main process of the to mention the services of product and levels
of the services. Despite form this some factors of risk have been assessed
while managing the uncertainty and insusceptibility in any consequences. The
validity and severity of the occurrence of the threats are of such an extent,
and the destructive budding of the threat poses such a threat to safety, that
instant vindication action is compulsory. Safety risks evaluated in the
acceptable district are satisfactory providing that suitable mitigation
strategies have been executed by the association.
Safety risks evaluated as primarily
deteriorating in the suitable county are adequate as they at present stand and
necessitate no achievement to bring or retain the possibility and sternness of
the significances of dangers under executive control. The preventable risks are
the internal risk which has been derived within the association and these risks
are controllable and avoidable. To ensure that the company has the space to
bear the errors and mistakes which will lead the company toward loss, as well
as company and for which accomplishing comprehensive escaping which will be
very expensive. (Villa, 2016) Strategy risks are
quite different from preventable risks because they are not inherently
undesirable. A policy with high predictable revenues usually entails the firm
to take on substantial jeopardies, and handling those dangers is a key motorist
in apprehending the probable gains. The company also acknowledged the high
risks of penetrating numerous loads under the exterior of the organization.
Despite the form, this organization
should have to talk about some of the risks that have been originating from the
incidents which have been obtained outside form the company which has been
impactful and controlled. Companies would adapt their risk-management
developments to these diverse classifications. While a compliance-based tactic
is active for dealing with unnecessary risks, it is exclusively insufficient
for approach hazards or exterior risks, which necessitate an essentially
different tactic founded on uncluttered and obvious risk negotiations.
As it has been discussed above that
risk management is crucial to apply this in all kinds of organizations and any
type of the business as it is small, medium or huge. Both above mention terms have
been used to evaluate the operations which is related to the finance as well as
contributing the compliance with the satisfaction. It is important to build the
bring the risk development in the factory and we can implement this in our
factory by focusing on the significance of the managing threats on daily basis
while observing the activities of staff members at all levels of the
organization. (Lannelongue, 2017)As well as it is significant for the
factory to accomplish the culture of risk management with in the association.
The factory should have to make some goal how to develop risk management. The
purpose of creating a risk management culture is to generate a situation where
allies and staff mechanically look for risks and deliberate their influences
when manufacture operative effective decisions.
1.1.3 Problem Statement of Impact of Risk
Management on Industrial Productivity
As it was mentioned above that Risk
management basically the process is to investigate and assess the controlling
the risk factors of the which have been occurred within the enterprises. So, in
this case, it is important to write the impact of risk management on industrial
productivity as well as their manufacturing services. It has been observed on
many companies that risk management is necessary to protect the company and
staff members have been suffering from the various threats. It is the liability
of the company to provide their employees and customer with proper safety.
1.2 Research Questions
of Impact of Risk Management on Industrial Productivity
The latest research study has been
conducted to find the answer of the research questions which has been presented
below:
·
What is the influence
of risk management in the industrial productivity?
·
Different ways to
solve the issues which is related to risk management.
·
various methods of
risk management to improve the productivity.
·
How can we apply risk
management in the company?
1.3 Research
Objectives of Impact of Risk Management on Industrial
Productivity
Some objective has been presented which
is related to the latest study
The main aim of the study is to identify the impact of risk
on the organizational productivity. As well as the purpose of conducting the
study is to identify the ways to resolve the problems which has been occurred
during the implication of risk management. Moreover, examine the improvement of
productivity. As well as also identify
how it will implement risk management.
1.4 Significance of
the study of Impact of Risk Management on
Industrial Productivity
The research study that has been
conducted is be disposed and contributing a lot. The main aim of the study is
to provide the excellent basis for the forthcoming research. The research has
been conducting on theoretical model and their insinuations of the study which
helping us by describing the impacts of the risk management in the productivity
of the industries. As well as the research also helping us by providing
appropriate ways to apply these methods for the safety and enhancement of the
efficiency. (Zalk, 2018)It
is important to build the bring the risk development in the factory and we can
implement this in our factory by focusing on the significance of the managing
threats on daily basis while observing the activities of staff members at all
levels of the organization. In the end of the study it would be said that
latest research incline to give both practical and theoretical efficiencies.
1.5 Summary
of Impact of Risk Management on Industrial Productivity
In this chapter, a detailed description
of the study has been done in which the significance of risk management has
been discussed. Risk management basically the process is to investigate and
assess about the controlling the risk factors of the which has been occurred
within the enterprises. As well as some other details have also been mentioned.
In this study, we will also discuss about the crisis management. As it has been
observed that some unplanned events can be happens in the organization at
anytime and anywhere which will leave his impact on the business. As well as it
would be said that latest research incline to give both practical and
theoretical efficiencies. Further, research objectives also mentioned in the
study better to explain the significance of the study and research question s have
also be presented to understand the purpose of the study. It is important to
build the bring the risk development in the factory and we can implement this
in our factory by focusing on the significance of the managing threats on daily
basis while observing the activities of staff members at all levels of the
organization.
Chapter 2.
Literature Review of Impact of Risk Management on Industrial
Productivity
For
solving the problems of industry productivity and risk management assessment;
there are wide ranges of literature reviews. The literature related to industry
performance is rapidly growing; it also comprises industries' productivity and
the adjustment of risk management. Therefore; there are different literature
reviews that have been carried out and conducted in developed countries. It has
been left the developing countries extremely beyond by the employment and
implementation of risk management in the industries sectors of these countries.
This section of the research study has been conducted in order to reflect the
performance of the various authors on this particular topic of the impact of
risk management on the industry's productivity.
The
risk management framework integrates information security and risk management
activities for the provision of a disciplined and structured method in the
system development life cycle (SDLC). Researchers introduce a risk management
framework (RMF) that provides the risk executive with the feedback during the
monitoring and through the decision of authorization such as spreading the
updated and upgraded information about risk to the owners of the information
system.

Figure 1: Risk management framework
The
picture highlights information all the steps of the risk management framework
that enlighten on its functionality about the self-managed subsystems or
system. The figure indicated its three levels having six elements or steps. All
of the mentioned levels and stages explained. Risk management contains two
steps, such as categorization and selection. Risk treatment contains three
steps, including implementation, assessment and authorization. But the risk
control contains only one stop, which is denoted by monitor. All steps of the
risk management framework explained mentioned below in section 2.8.
2.1 Risk management plan of Impact of Risk Management on
Industrial Productivity
According to Author Coronado, et al (2014) it is conducted that the risk management plan is that documents
where the project manager ready to foresee the risk which also estimates the
impact as well as explained the different responses to the issues. The risk is
the uncertain event which also occurs the negative along with the positive
effects of the project objectives. The plan of risk management is also
containing the different analyses of the same risk by the low and high impact
with the strategies of mitigations which also helps the project to avoid being
the derailed common problem that arises. The aim of
the risk management plan which also provides the different procedures that
manage and control the risk. The risk management plan can also have explained
by the one phrase “Plan”. Basically, risk management is the step-by-step
instructional documents which are also anticipating, identifying scenarios that
could also put the project risk and determine the methods plus means to solve
the risk. There is the different corporate level
of risks which is the governances as well as risk management and help to every
function. The risk management is the plan which is also responsible for
ensuring compliance by the rule. Laws and regulations that occur. Therefore;
the corporate of compliance also creates as well as executes the compliance
program of the organizations (Coronado, et al, 2014).
2.1.1Key components of the Risk Management Plan of Impact of Risk
Management on Industrial Productivity
There are the following key
components of the risk management plan;
·
Methodology
·
Responsibilities and risk
·
Impact of probability
·
Impact Matrix and probability
·
Revised stakeholder tolerance
·
Budgeting
·
Tailoring
·
Risk categories
·
Tracking
·
Reporting formats (Salau, 2019)
2.2 Risk Management
and Business Continuity Management Approaches
Following are
the risk management approaches that are better suited to the needs, and should
be
considered
before making investments:
·
There is a need to
establish a credible maximum plan for loss minimization. It deals
·
with the asset
valuation.
·
The assets need to be
allocated properly as per the capacity of the available resources.
·
The immense need for
the provision of the margin of security.
·
Avoid portfolio
volatility up to a maximum extent.
·
Over performance in
the market by rethinking about the time horizon.
2.2.1 Risk management
effect on organizational decisions
It is reviewed by the author Saleem (2018),
decisions are made with precision in the presence of effective risk management.
The organization becomes very successful after implementing effective risk
management, although various organizational decisions are not practicing the
activity that proved to be unsuccessful. The risk management is very effective
that consists of the different steps are establishing context, treating,
analyzing, that allow the improvement of the organizational decisions is making.
2.2.2 Calculating the
current risk level
For
calculating the present risk, portfolio beta must be calculated first which is
the individual betas’ weighted average. Portfolio’s required return must be
calculated using the formula of CAPM [6].
Risk management
adds value plus comes up with many aims for an organization. Some of these aims
are: increasing the level of system security, then protecting as well as
enhancing the organization’s assets, optimizing operational efficiency and come
up with well-informed decisions (Saleem, 2018).
2.2.3 Risk management
framework in cloud computing
According to the Author Fan et al , (2012)
the framework of risk management is explained in cloud computing. The three different
types of perspectives are used by the researchers on doing a risk assessment of
cloud computing. The first proposed risk assessment frameworks can be used only
by a cloud computing consumer
2.2.3.1 Policies
In
real terms, there is not any specialized policy designed actually to cover the management
of risk in computing cloud of risks. However, there are some traditional
policies like:
·
Network Security and
Privacy Insurance
·
Privacy-Data Breach
Insurance
·
Cyber breach Insurance
·
Cyber Security
Liability Insurance
The
partial coverage is provided by these particular policies in terms of applying
cloud computing risks like the internet or cybersecurity and information.
However, when coverage is reviewed, and exclusion is noted in these policies,
some of the associated risks with cloud computing are easily recognizable. The
risk excluded as well as covered by these policies come up with six categories
such as social engineering, legality, rogue employees caused damages, natural
disaster damages, operational or administrative risks, and system vulnerability.
It is important to mention here that most of the earlier mentioned work is
summarized, which is related to risk management of management and
organizational issues in cloud computing, and cloud migration with lack of any
focus. When a different type of perspective is used to identify risk factors,
and these include cost-effectiveness, security, service level & competency (Fan et al , 2012).
2.3 Benefits of risk
management of Impact of Risk Management on
Industrial Productivity
Okubo (2014), has been contended
that no doubt there are several benefits of risk management but there are various
pitfalls that can harm industrial productivity by reducing the qualities of
services. Therefore, even the various new opportunities are offered to the
industrial by risk management but it has various challenges as well. Sometimes,
the challenges can enhance due to the innovation of information technology and
its applications. The market boundaries and its blearing; it also includes the
industrial barriers breakings. A potential of a fraud on customer’s accounts
can enhance as well due to this (Okibo, 2014).
There
are several efforts that have been made by the Siam
(2006), for exploring the revolution of IT (information technology) and
risk management that is known as e-banking on the performance of the banks. For
example, Siam (2006) planned for exploring the industrials performance impacts
of risk management on industrial productivity by utilizing the questionnaire
which was distributed across the numerous industries in the region of the
KSA. It has been observed by the findings
of the studies related to the impacts of risk management on industrial
productivity and it will be the quality of the services that are offered by the
numbers of the industries. But if its effects will be measured in the long run
it will positive and it can enhance the performance of the industry effectively (Siam, 2006).
According
to Author Sarji (2017), there are different
studies that have been revealed in order to convert a system of the industries is continuously moving towards the automated
from traditional. Due to this, the business operations have been supported as
well as it helps as the competitive edge in order to realize the control of
operations, increase in service delivery, higher efficiency, reduce the human
errors, branch productivity, maintaining the customers, customer services,
real-time of information systems, risk management, reduction of branch offices,
accurate fund transfer, reducing the numbers of the staff in branch and
reducing the cost by utilizing the various labor-intensive methods along with
the computerized process. By utilizing the information technology the
performance of the can enhance due to which profit will increase as well by
reducing the cost (Sarji, 2017).
2.3.1 Productivity of industry of
Impact of Risk Management on Industrial Productivity
According to the
Author Ahlemann (2009), the second point is about the productivity
of the industry which impacts the is required for risk management. This system
has some strengths and weaknesses based on this that system can be evaluated.
Three groups are playing an important role in increasing the importance of this
system. This is because it has a formal control system, external integration
and risk management system. There is only one weakness in this system and that
is it was not highly efficient in formal controlling technique. This is because
it requires a lot of time upgrading the whole system. If the risk management
system is improved so that they according to that system efficiency can be
increased easily (Ahlemann, 2009).
According to the Author Yakemovic (2000),
it is conducted that the third point was about the quality cost for the risk
management of the industries' productivity. The strength of PROMQACS is that
this system has the ability to calculate the quality cost for the project
system. This is because it will improve the quality of the cost of the
information system that is required for the construction industry. This
software has the ability to improve the efficiency of the system in a proper
way and have the ability to manage the proper cost for the project. There is
some weakness in this software that includes. This software is not highly
efficient to use and also it is not user-friendly. This software is only
related to the construction industry only and this is one of the main reasons for
the weakness of that software (Yakemovic , 2000).
2.4 Risk management
of Impact of Risk Management on Industrial Productivity
There
is a systematic mechanism called risk management, which helps organizations to
manage their risks and threats, and help them to cope with those threats by
looking at their consequences, and come up with action by assessing &
understanding the risk and then identifying the process for communicating those
risk issues.
2.4.1 Risk assessment
methodologies
There
are two types of methodologies for risks assessment which are
·
Quantitative
·
Qualitative.
2.5
Description of risk
2.5.1
Risk reduction
Risk
reduction is all about reducing the possibility of loss and minimizing it. Risk
reduction deals by reducing the severity of the likelihood.
2.5.2
Risk transfer
Risk
transfer is actually controlled and risks management strategy that seems to
involve a pure risk’s contractual shifting to another party from one. Risk
management is a strategy that is not used often as well as tends is more common
in the projects in several parties.
2.5.3
Risk sharing
Risk
sharing is all about the allocation of losses and premiums among the group of
policyholders on the basis of a predetermined formula.
2.5.4
Risk avoidance
Meanwhile,
risk avoidance concerns the elimination of exposures, activities, and hazards.
By eliminating the several exposures of the risk which poses the potential
loss, in this phase, the risk avoidance deals with all these problems.
2.6
Determine an acceptable level of risk
To
determine the acceptable risk, the first step is all about determining the
projected payout. Next, the profit margin must be accounted for and subtracting
it from the risk value that is maximum.
2.6.1 Manage to
accept the level of risk of Impact of Risk
Management on Industrial Productivity
Accepting
the level of risk is a maximum for overall exposure in the risk that should be accepted
for the organization and based on the cost benefits. There are various methods
for managing the acceptable level of risk;
·
Accept the Risk
·
Avoid the risk
·
Transfer the risk
·
Mitigate the Risk
·
Exploit the Risk
2.7. Improve
productivity with Risk management of Impact of
Risk Management on Industrial Productivity
It
is reviewed by the Flippingheck.Com (2019) , improve
productivity by the risk management, whereas the risk management includes determining
of different potential as well as removing
then whatever it possible . Risk management also improves productivity as well
as also creates more success which is required for the business. In terms of safety,
safety is the most critical component which is measuring success in the industrial
firms (Flippingheck.Com, 2019) Risk management can
reduce taxes when tax schedules are convex as well as can reduce the expected
costs of distress. Risk management adds value to the firm by preventing
underinvestment. The industry provides an excellent setting to conduct an
analysis of the effects of risk management.
2.7.1 Success Factors of
Impact of Risk Management on Industrial Productivity
According to VTT (2017), Risk management can boost;
§ Productivity
in existing plants
§ Performance
of your investments
§ Success
in your IoT strategy
2.7.2 Entrepreneurial Ideas of Impact of Risk
Management on Industrial Productivity
A major
strength of the company is the entrepreneurship capabilities where manufacturing
industries have remained highly aware of the changing trends and the market
gaps to identify the new ideas for expansion. It is identified that the
innovative capabilities of the company help it stay competitive and successful
in the long run through the risk-taking approach and the desire to seek for new
ideas Excelsior initiates with the fashion apparel and expanded into the
manufacturing of clothes for the hospitality industry. Now, based on the
changes in trends for tourism and outdoor apparel, the company intends to take
advantage of the online platform to launch its specialist apparel that will
serve the purpose of adventure clothing and fashion clothes both.
2.7.3 Financial Strengths of
Impact of Risk Management on Industrial Productivity
The company has
a strong financial position in the industry, given its efficient strategies.
The company has a policy of no selling on loss and charges a margin of 25%.
This ensures a safe profit for Excelsior and creates a provision for the
company's financial reserves for future innovations. Moreover, the company
keeps a close check on its short-term financing policies and its liquidity
conditions to avoid cash flow issues, resulting in financial success (VTT, 2017).
2.8 ways to handle Risk
management
In this level, analysis of the cloud
environment will perform for the identification of the effective and potential
vulnerabilities and short-comings. This level has two steps for gathering
information and then analyzing. The steps are as follows categorization and
selection.
2.8.1 Step 1:
Categorization of Impact of Risk Management on
Industrial Productivity
The information system concerns the
processed, transmitted, and stored information by the proposed system, which
based on the system impact analysis. In this step, the proposed information,
data about risks are categorized by following some rules that belong to the
operations identification, its performance, requirements of privacy and
security.
2.8.2 Step 2:
Selection of Impact of Risk Management on
Industrial Productivity
This step is based on the security
that is categorized and concerns with the initial set of security of controls
for the information systems, which refers to the security controls of the
baseline. The proposed baseline security controls set on the assessment of the organization
for risk and its current conditions of the environmental operations. The
strategy will be made up of monitoring the security controls for the evaluation
of the effectiveness of security control. In the end, you have to write all the
controls and outcomes into a word document along with the remarks that show
where the issues occurred and how they could be refined in the security plan.
The last thing is to take a look again for the review and approve all security
plans (Sabri Boubaker, 2016).
2.9 Risk
Treatment of Impact of Risk Management on
Industrial Productivity
According
to the author Cornaggia (2009), it is conducted to improve the
productivity of the industries in terms of safety and the money. Risk treatment
is concerned about the treatment in the risk management framework where we can
check the design mitigation plans and the related policies. The proposed level
has three following steps, such as implementation, assessment, and the third
one is an authorization.
2.9.1 Step 3: Implementation of
Impact of Risk Management on Industrial Productivity
The implementation step indicates
the implementation of the security controls as well as gives a brief
description of how the controls employed within its environmental operation and
the information system.
2.9.2 Step 4: Assessment of
Impact of Risk Management on Industrial Productivity
it is all about to assess the
security controls by using the proposed assessment procedures which documented
in the assessment planning. It is a very useful step in the risk management
framework or in the risk management process which identifies that if the
security controls are being implemented correctly without any error or fault as
well as it is fully functional or effective in producing the required outputs (Cornaggia, 2009).
2.9.3 Step 5: Authorization of
Impact of Risk Management on Industrial Productivity
This step is all about the
information system operation, which based on the identified risks in the
results from the information system ‘s operations. Just identify the real
outcome and decide on risks that they are acceptable or not. If it is
acceptable, then you should go further. All organizational operations such as
the image, reputation, organizational mission or functions, organizational
assets, and the other requirements also performed in the assessment of risks
step.
2.10 Risk
Control
2.10.1 Step 6: Monitor of
Impact of Risk Management on Industrial Productivity
This step for the security controls
of the information security systems is one of the most important steps for risk
control. In the risk management framework on the bases of assessing the security
control effectiveness, making changes in the documentation of the proposed
system or the environment of the operations, effective analysis about the
proposed changes as well as the stated or highlighted security of the system to
the designated of the organizational officials and concerns with the other
required things.
According to Author Georgiadis & Pitelis (2016),
it is conducted that, the risk management to improving productivity in the
small and medium enterprises. are not
certain why staff training of employees is much important than the managerial
staff and HRM staff. The reason is that staff skills are much important than
the managerial staff because the organization relies on the abilities of lower-level
staff because they take part in operations as well as firm productivity while
the upper-level staff only make policies and make decisions. This is the reason
why the firm emphasis on training of non-managerial staff training than those
of managerial staff. This argument states that non-managerial staff is the
helping hands of the firm. Trained staff increases firm profitability and
productivity. More and more the staff will be trained more and more firm
productivity will increase. Labor considered the backbone of any firm because
the firm productivity depends upon them (Georgiadis & Pitelis, 2016).
Non-managerial
staff such as employees working on the lower level needs training for
increasing Labor productivity and profitability. Staff training helps them to
meet new challenges and opportunities. A training scan is done on a weekly
basis as well as on a monthly basis. Employees training also help the managers
to perform the high-level task to meet the market and high arising challenges
of the business environment. Trained staff can perform many times better than
non-trained staff. In the case of construction companies, their estimate of
completing work in weak is only possible through a well-trained staff. Although
the effect of training is still positive it also has some negative effects on
staff and reduces their performance. Firm who have free training services for
their employees must keep balance among managerial and non-managerial staff
training. On the other side training also create an average effect on some
employees in small and medium enterprises.
Such
programs minimize workplace conflicts and promote unity as a result of which
employees show more productivity to contribute to the profitability of the
organization or brand. Findings support the idea that association of employee’s
productivity with employee’s job satisfaction and positive organizational
culture is a reason to spend on diversity training programs. Researchers
conclude a positive significant relationship between diversity training
programs and innovative practices in an organization. Moreover, diversity
workplace also leverages advantages related to teamwork and reduction in
discriminative practices. Although, inappropriate and ineffective diversity
training can also promote backlash among employees. Additionally, the turnover
rate will also increase in the organization because of poor outcomes of the ineffective
diversity training program
2.11 Risk
Management for Cloud Computing
Cloud computing is one of the finest
computing strategies that have the potential to provide flexible, agile and
cost-effective information services. Under the paradigm of cloud computing, the
cloud service provider (CSP) given up direct control on many security aspects
and privacy by some organizations. Many organizations are using cloud services
at the same time that are still accountable for availability, confidentiality,
and integrity of the related information and information about the system
hosting the cloud service provider (CSP).
As a result, the information system
security practice of risk management must be extended by the organization’s to
add up the cloud environment. The shareable nature of using and operating the
cloud environment changes that will be responsible for the construction or
implementation, functionality and maintenance of the security controls.
Therefore, the organization who is using cloud computing must need to take
understandings of cloud security to address all the risks effectively. The organization’s
or corporation can address the risks effectively by understanding about cloud
security (Carlin & Curran, 2013).
To establish the cloud-based
services, the government designed and constructed the integrated risk
management approach for the adoption of cloud computing. So the proposed
approach, which is designed and developed at the governmental level, could be
applied to all the services on cloud-based. This approach could be applied
independently to all cloud-based services and could apply to the deployment
models.
The cloud service providers (CSP),
due to the economies of scale, have the potential to offer state of the art in
the cloud ecosystem and secure than a customer’s environment who are
controlling their own systems. In simple words, it has the potential to give
benefits to many organizations effectively. Moreover, there is a need to make
visible the customers' data of the business into the cloud provider’s service,
to build up the essential trust for the cloud-based solution in the sense of
adoption benefits to store the customer’s data in the cloud (Osmanoglu, 2013).
The
stored data in the cloud is so much sense and commonly considered against the
proposed incurred security and the risks in privacy. In simple, the cloud-based
solution benefits should depend on the cloud model, the kind of cloud service,
type of complexity level, type of involved data, several services types and
also depends on the different types of the requirements. The information
systems which based on the cloud are exposed threats, and it can have negative
effects on the operations of organizations such as the functions, missions,
vision, or reputation (Loske, 2015).
The
malicious entities in the cloud could be very harmful, which can damage the
information or the incurred data of the customers. However, it can damage the
stored information into the cloud database of customers of the organization and
availability of the confidential information by those systems. There are
several kinds of risks that should be addressed by the organizations for the
solution. However, risk management considered a holistic activity, which is
full-fledged integrated with every aspect of the organization.
The
selection of the appropriate management satisfies the requirements of
Information security from the standard catalogs of controls and security. The organization
should do quantify its risks which are acceptable to prevent or minimize the
threats, negative actions, attacks or compromises. In other words, the organizations
that are using cloud services, they may face many threats and negative actions.
So, they need to count all the risks which can damage the service or
confidential information to prevent or mitigate the threats, disruptions in the
service, cyber-attacks and adverse actions (Ackermann, 2012).
For
the management of the information security risk effectively at the ecosystem
level, you need to establish the following high-level elements.
·
The risk management
responsibilities assigned to the cloud actors would be involved in the cloud
ecosystem’s orchestration. Every cloud actor should assign the responsibilities
to the respected representatives, managers, leaders or executives internally.
·
Under the instructions
of service level agreement (SLA), the establishment cloud ecosystem widely
tolerance the risks as well as communication of such risk tolerance. It needs
to add up the information on the decision-making activities which can be
impactful on risk tolerance.
·
Near the real-time
recognition, screening, monitoring, and understanding of information security
systems by every cloud actor from the risk operation are.
·
The cloud actors count
up the threats, malicious actions or attacks, decision making in the risk
management process, and the solutions during the real-time information sharing.
Chapter 3. Methodology of Impact of Risk Management on
Industrial Productivity
As
it has been described by the title, this chapter illustrates the materials and
methods that are particularly used to conduct this study. It also includes the
particular methods that are required to explain the phenomena of the research
on a particular topic. Moreover, under this section, the various research
strategies have been outlined by the researchers for exploring the process and
steps of the study that are adopted to conduct this study. It explains research
design, research methods, research approach, research philosophy, sources of
data collection, data collection methods, tools to collect the data,
instruments of the study, time horizon, unite of analysis, ethical
considerations and research analysis.
3.1
Research Design of
Impact of Risk Management on Industrial Productivity
The
methodology is considered as the theoretical and systematic analysis of the
particular methods that are usually applied for the field of the study. It also
contains on the principals as well as theoretical analysis of the body methods
that are linked with the particular branch of the knowledge. Generally, it
includes the specific concepts for instance; theatrical model, paradigm,
various phases and techniques such as quantitative and qualitative. The terms
of the methodology have not been set out to offers solutions to the study.
Hence, it cannot be said that the methods are similar for all kinds of study.
The design of the study is always decided by considering the topic and type of
study. The research type for measuring the impacts of risk management on the
productivity of the organization is described in explanative manners in the
next section of the study. It has been observed that the particular research
design is necessary in order to evaluate the “impacts of the risk managements
on the productivity”.
3.1.1 Advantages of Research Methodology:
There are
various advantages of the research methodology that are required to conduct
this chapter in any research paper and dissertations.
·
It includes the
development of the wealth of human beings.
·
To research the
particular topic it offers numerous tools.
·
It can develop the
disciplined thinking, scientific and critical attitude for observations.
·
It can use to
developing the research provisions and process for the off chance in the
particular study and depth.
·
It can use to
instructing the capability of examining the utilization of the research along
with reasonable confidence for the process decision making.
·
It can represent the
ability to lean and thinking critically.
Several
activities are included in the process of the research methodology. The proper
sequences are required for arranging allow of these activates with the
accordance of the timing that is used in this entire process of the research.
3.2
Research Type of
Impact of Risk Management on Industrial Productivity
Various kinds
of research can be used according to the topic and requirements of the study.
All of these kinds of studies are exploring here from which the types of study
that nest fitted for this topic are explained in good ways. These types are including
as;
3.2.1 Experimental Research of
Impact of Risk Management on Industrial Productivity
Usually,
it is known as the cornerstone of science and defined as creative research.
These kinds of research are usually concerned with the cause and effects. Even
under these kinds of research, the interesting variables are defined in
effective manners. The relationship between the dependent and independent
variables explain under this kind of research. These kinds of research are
required to examine the changes in cause and effect independent and independent
variables.
As
has been discussing previously; the topic of the said study is the impact of
risk management on the productivity of the organization and the nature of this
topic is experimental; because it requires examining the relationship between
independent and dependent variables. So, to measure the impacts of the risk
management on productivity this type of research is suitable. Under this kind
of research data will be collected by conducting the various experiments in the
field. Even, it will be in the survey form. The survey experiment will perform
on the employees of the manufacturing and processing industry.
3.3
Source of data collection of
Impact of Risk Management on Industrial Productivity
There are two major sources of data collection from
which the first one is the primary source of data collection and another one
secondary source of data collection. Both of these kinds of sources are
important and essential factors for conducting this kind of research. The said
study is conducted by utilizing both the source of data collection. It includes
primary and secondary. As the under considerations
and above discusses topic” impact of risk management on the productivity” is
wider topic and it requires a lot of data collection that’s why both sources of
data collection are particularly used in the said study. Secondary Sources can be
gained from book, specialized International Journals,
Publications and the World Wide Web; also the researcher can make use of what
was written in the literature in similar fields.

Figure 2: Path for data collection
3.3.1 Primary Data
Collection of
Impact of Risk Management on Industrial Productivity
In the primary source data
collection; it includes information processed and collected that is directly
conducted by the researchers, for instance, focus group, observations, interviews,
and surveys. There are various kinds of primary data collection and these are
used according to the nature of the study. A few of the most important and
prominent methods of data collection are includes; experiments, observations, questionnaires, and interviews. There
can several other methods of the data collection, but that are not well known
and not used commonly. From the data collection methods; the primary source of
data collection is most important, authentic and original (Ajayi, 2017).
There are various assumptions of the primary source of data
collection. It includes;
·
Data that is collected by the evaluator is
utilizing the various methods for instances; interviews, surveys, and
observations.
·
It can be more time consuming and expensive while
it requires various data collection.
·
It provides an opportunity for reviewing the
entire kinds of secondary data that are required for collecting the primary
data.
3.3.2 Secondary Data
Collection
The particular information is
included in the secondary source data collection that is retrieved by using the
preexisting resource such as library searches, research articles and browsing
on the topic from the internet. The records and data are also included in the
preexisting data that is used for already existing programs such as; data of
the clients and students, publications, staff performance reviews, financial
records and training materials.
3.4
Research Methods of
Impact of Risk Management on Industrial Productivity
There
are two major kinds of research methods that are adopted for this study. These
methods are; qualitative and quantitative. Both of these research methods are
utilized to attain the particular objective of the research study.
3.4.1 Qualitative research methods of
Impact of Risk Management on Industrial Productivity
For
the said study it is one of the most important and well-known methods to
conduct a particular study. The most important and major characteristic of
qualitative research is that it is the most important and well-known technique
for the small samples meanwhile its results and outcomes can be easily
measurable and quantifiable. It can easily offer the complete description as
well as analysis of the research subject without any considerations of the
nature of the responses of participants. It can explore the process of the
study along with the scope of the research. Therefore, the qualitative research
and its effectiveness are based upon the various abilities and skills of the
researchers though the results cannot be perceived as reliable. The information
in the qualitative research method comes from interpretations and personal
judgments. It is a good technique for a small sample size as the size of the
5-20 persons, individuals, and groups. But this study adopted this method to
explore the literature and theories of the various other authors on this
particular topic as the impact of risk management on productivity (Bell, 2005).
3.4.2 Quantitative research of
Impact of Risk Management on Industrial Productivity
The numerical data is always
collected in quantitative research. This study is quantitative in its research
methods because the data that will be collected by conducting the survey will
be coded and recoded in the numerical configuration for collecting accurate
data. In the quantitative research methods, it also includes the implementation
and generation of the charts tables and graphs that are required to
manipulating and generating the data in extensive manners. This research method
is particularly utilized to explain the views of the large numbers of people by
collecting their data in various coding. In quantitative research, the most
important and first step is to examine your sample design and sampling. Then,
it requires gathering the data. The most important at best suitable methods
involved as a survey that is used in the said study to examine the impacts of
risk management on productivity. This survey will be collected and conducted by
utilizing a structured questionnaire. The surprising complex subjects can be
explained by this survey design (Krizman, 2011).
3.5
Research Approach of
Impact of Risk Management on Industrial Productivity
The
research approach is considered as the process and plan which is contained on
the particular steps of the braid assumptions for the required detailed methods
of data collections. It also includes interpretations as well as analysis.
Therefore, it is based upon the nature of the study and research problem that
is being addressed to research the particular topic. Generally, it is known as
the approach of data analysis and reasoning as well as the approach of data
collection (Wilson, 2010).
3.5.1 Deductive
research approach of
Impact of Risk Management on Industrial Productivity
The research approach that was being
used to follow the purposes of the said study was known as the deductive
research approach. Because the set of the hypothesis has been formulated for
the said study and to attain the objective of the research that why it will
follow the deductive research approach and for measuring the risk impacts of
the risk management on the productivity the formulation of the hypothesis is
necessary. In this deductive research approach; the impacts of the risk
management of productivity has been analyzed by developing the various
hypothesis that is being tested during the process of the research (Grover, 2015).
Developing the hypothesis is always
concerned with the deductive approach that rebased upon the existing theories.
After developing a hypothesis; it includes the designing of the research
strategy to test the hypothesis for conducting various kinds of results (Denzin
& Lincoln, 2005).
For the said study the deductive research approach is adopted because the
deductive research is known as the reasoning from the specific to general. If
the common connection and association are similar to be implied by the specific
theory of example and it can be true in several cases. For a particular study,
the deductive design is particularly used for testing that links or
relationships can be obtained for various circumstances.

Figure 3: Deductive research approach
3.6
Research Philosophy of
Impact of Risk Management on Industrial Productivity
Research
philosophy is considered as the belief that is related to how the data related
to the particular phenomena or process should be utilized, collected and analyzed.
There are various philosophies of the research approach has been encompassed by
the term of epistemology. This term has been derived from the purpose of the
purposes of science. It also includes the process of transforming the various
things that are believed in the thing approach. There are various kinds of
research philosophes that can be utilized or adapted according to the nature of
the study. These philosophies are also known as the paradigm. It includes the
positivism paradigm, interpretivism paradigm and pragmatism paradigm (Saunders,
2009).
3.6.1 Positivism of Impact of Risk
Management on Industrial Productivity
According
to the nature of the study, the best-fitted paradigm for examining the impacts
of risk management on productivity is the positivism paradigm. Thus, study
follows the quantitative research methods and deductive research approach in
which the formulation and developments of the hypothesis are observed. That's
why the positivism paradigm is considered as the best philosophy in order to
conduct this research on a particular topic (Caldwell, 2015).
In
the positivism philosophy, it has been believed that reality is stable and it
can easily describe and observed from the objective viewpoints. It is easily
being studied without interfering along with the phenomena. It has been
contended that phenomena must be isolated and its relevant observation can be
repeatable. The manipulation of the reality is often involved in this with the
accordance of the variations in single independent variables. It is a good
philosophy for the identification of the regularities. It plays a central role
in order to form the relationship between independent and dependent variables.
In order to accepts and reject the hypotheses that are developed for measuring
the impacts of the risk management on the productivity the positivism paradigm
is best fitted.
The
said study follows the positivism research paradigm under the inductive
research approach. This is the best philosophy for this particular study because
this study is conducted by considering the quantitative research methods. All
of the results of this study were generated in numerical forms. Under the
quantitative research methods, the numerical interpretation of the results
along with the various graphs and charts are the best ways to explore the
outcome of the study in extensive manners.
3.7
Sampling techniques and size
By
considering all of these stages of the sampling technique that was adopted for
the said study is one of stratified sampling as well as simple random sampling.
These results from the fact that there is a need to first classify the target
population into those in management positions and those working on the
industrial equipment. There are also strata for those in manufacturing
industries and those hailing from the processing plants. Classification of the
target population is necessary given the fact that a specific number of slots
have been awarded to various subgroups. As such, other sampling techniques such
as random and systematic sampling would not cut it since they do not give
special attention to the concept of classification but rather pick the sample
from a diverse population (Taherdoost, 2016). The other reason
for the selection of stratified sampling is because of the need to eliminate
the possibility of sampling bias. Sampling bias is normally witnessed in a case
where the resulting sample consists of the population with the same
characteristics.
Sampling
has been done in such a way that the employees whose jobs directly relate to
risk management are given more slots as compared to the rest. This will be done
in order to guarantee high-quality data is obtained from the research sample.
The research sample will consist of 70 individuals. One of the reasons as to
why this sample size has been chosen is to allow for comparison of data
obtained from individuals to ensure consistency. Out of the 70 slots to be
filled, 45 will go to the manufacturing industries whereas processing plants
will get 25 slots. 40 and 20 employees from manufacturing industries and
processing plants respectively will be those who operate the industrial
equipment on a daily basis. The rest of the slots will be filled by those in
the management position. The intent is to solicit information about the
frequency of risk occurrences; this will be obtained from the 60 low-level employees.
The purpose of those in management is to provide information on whether they
have implemented any risk management model and what such action has had on the
productivity of the industry.
3.8
Population of Impact of Risk
Management on Industrial Productivity
For
the particular study where the population can be counted easily or it can
measure perfectly it is known as the finite population. Such as the population
for this study is known as a finite population because the data is collected
from only three industries. Meanwhile, that population that cannot be counted
easily is usually known as the infinite population. The adults in the KSA are
known as the infinite population. It cannot be said that they cannot be counted
they can be counted but after a long, complex and difficult process. Any kind
of the particular value that can be easily measured identified and counted from
the difficult characteristics of the entire population is known as the
parameters. The survey process for collecting the data from the entire
population is referred to as the census.
The
target population of the project will be workers who will be taken from two
manufacturing and one processing industries in the KSA. The two manufacturing
industries will be selected from those involved in the production of mobile
phones, steel, automobiles, and construction materials. As for the processing
industry, this will be selected from the various chemical processing plants,
such as the sulfuric acid plants. The reason for the selection of manufacturing
and processing industries as the source of the target population is because the
core objective of the study is to determine the correlation between risk
management and productivity specifically in industries. It, therefore, suits
that the target population is employees of industries since these are the
people with firsthand information concerning the daily operation of the
industries. For the success of the project, vital information such as the
frequency of breakdown of production equipment will be necessary to enable
drawing valid conclusions (Marucco, 2011).
3.9
Instruments of the Research
of Impact of Risk Management on Industrial Productivity
There
are several tools that can be utilized to collecting the data from the
respondents by conducting an accurate survey. For the said study the
questionnaire is considered as one of the most important and well-known techniques
for collecting the data from the respondents. Under the inductive research
approach the quantitative research methods this is the most important essential
tools that can be employed in this study collecting the data and knowing the
reviews of the people on a particular topic (Colton, 2007).
There are the
few steps that have been discussing in order to formulate the questionnaires
and these steps are;
·
The research must be
aware of the meanings of the words while formulating the questionnaires;
·
There should not be
the double meaning of the words in questionnaires.
·
The questionnaires
must be written in easy wording and understandable languages that can be
understood easily by anyone of the respondents.
·
In the questionnaires,
the question must be easy and simple there should not be any technical terms.
·
The ethics writing
must be followed while formulating the questionnaires.
·
There should not be
humiliating in the questionnaires for the language of the questions.
By
considering and following all of these discusses steps the questionnaires has
administrated for conducting the adapt related to this particular study. This
questionnaire contains the two major sections. The first section explains the
demographic profile of the respondents meanwhile another one explains the
detail related to the various constructs that are exploring the relationship
between risk management and productivity. This questionnaire has been designed
in very easy language and the section of the vocabulary is quite accurate
according to the standards of the respondents. This questionnaire has
administrated by considering the respondents from the Kingdom of Saudi Arabia.
Questionnaires
are considered as the group or set of the questions that have been prepared or
arranged in order to ask the number of the questions from the various individuals
as well collecting the data from the respondents who are considered as the
audience for the said study. The copy of the questionnaires has been designed
in the electronic forms that are not answered by the individuals. The blank
space has been designed in front of the question to answer all of these
questions in good ways. The questions
designed in this questionnaire are open-ended. This questionnaire has
administrated by considering the five-point Likert ranging scales from strongly
disagree to strongly agree.
3.10 Research limitations of Impact of Risk Management on Industrial Productivity
The
limitations are the necessary step and major aspects for any kinds of a research
study because it maintains the boundaries for the research process. There are
the following research limitations that can be employed in such kinds of
studies. It includes;
·
The sample size in the
said study is relatively moderate because it neither too small nor too large.
In this study, the sample size is 70 individuals only. This sample size
selected because by selecting a bigger sample the reliability of the research
can be enhanced probably.
·
The measurement of the
examined problem cannot be allowed in qualitative research.
·
The impacts of the
independent variables on the dependent variable cannot be measured easily.
·
In numerous cases; the
participants can be refused to respond to the questions.
·
The participant has
the liberty to respond to the questions according to their views.
·
The participant’s wok
is forced to fill the questioners
·
This study is only
conducted in the entire region of Saudi Arabia.
·
The data is collected
from only three companies.
·
To get and collect the
secondary data from the records of the financial reports would not be allowed.
·
Employees, workers,
managers, and dealers were hesitant and reluctant for sharing the data.
·
The management of the
organization cannot be like sharing their various views on a particular
topic.
·
There can be major
difficulties in the completion of the research such as; location factors time
and cost.
·
In the said study, the
sample size cannot be exactly representative of the universe.
·
There are various
errors that can be possible during this study and these are limited for the
extent of the study.
·
Due to all of these
limitations; the study has maintained its effectiveness for the research work
by using the sincere efforts that were put out.
3.11 Ethical considerations of Impact of Risk Management on Industrial Productivity
There are
certain ethical issues that have been subjected to the said study. As it has
been described earlier that all of the participants have to fill out the
questionnaire; it means the written acceptance has been reported by all of the
participants. It also includes their written acceptance related to the
participants in the field of the research.
·
The sample members
have been asked for filling the questioner with a similar period.
·
The confidential
statements have been designed on the top of the questioner for ensuring the details
of the respondents.
·
The respondents are
committed or promised for not disclosing their information for any purpose.
·
The major objective
for the survey questioner has reassured the participants for their participation.
·
The reference letter
has been assigned from the department of the university for ensuring the
respondents about the authenticity of the research.
·
Before visiting the companies,
the proper permission letter and appointment has been taken from the manager of
the department.
·
They were free to
withdraw from it at any point and for any reason.
·
The participants of
the research have been fully informed and aware of the research study's
objectives.
·
The participants are
thankful for offering their views and they were treated as confidential data of
the study.
·
The respondents are
assured that this study is conducted for academic purposes.
·
The most important
things are that the participants of the study were not abused and harmed.
·
The perception of the participants
has been considered in good ways for the psychological and physical perception.
·
This study is
conducted during the research conduction.
·
In contrast, the
researcher attempted to create and maintain a climate of comfort.
Chapter 4. Analysis and Results of Impact of
Risk Management on Industrial Productivity
In this chapter, the data is collected
from the previously collected questionnaires, however, the data analyzed by
using the SPSS. Consequently, mean, frequency, range, median, mode, correlation,
regression, and variance are performed on the dependent and independent
factors. The influence of Risk Management IV on Industrial Productivity DV is
determined in this chapter. The values obtained have significance values as P
0.000 or less than 0.05. it could be noticed that there is a positive
significant relationship between the variables.
Frequencies
of Impact of Risk Management on Industrial Productivity
|
Statistics
|
|
|
IV
|
DV
|
|
N
|
Valid
|
80
|
80
|
|
Missing
|
0
|
0
|
|
Mean
|
2.6400
|
2.4167
|
|
Median
|
2.6000
|
2.3333
|
|
Mode
|
3.00
|
2.67
|
|
Std. Deviation
|
.62796
|
.53170
|
|
Variance
|
.394
|
.283
|
|
Range
|
3.00
|
2.33
|
Table 1: Statistics
In the above
table the values of the dependent and independent variable are considered as
the value of the mean of the independent variable is 2.6400 and the value of
the mean of the dependent variable is 2.4167, the value of median of the
independent variable is 2.6000 and the value of median of the dependent
variable is 2.3333. However, the value of mode of the independent variable is
3.00 and the and the value of mode of the dependent variable is 2.67. the value
of Std. The deviation of the independent variable is .62796 and the value of std. deviation of the
dependent variable is .53170.
Moreover, the
value of the Variance of the independent variable is .394 and the value of the
variance of the dependent variable is .283. the value of a range of the
independent variable is 3.00 and the and the value of the range of the
dependent variable is 2.33. It could be known after getting the results that
these values are less than 4 however, it means that the model is considered a
good fit because there is no negative value and the relation between the
independent variable is considered positive or significant.
Frequency Table
of Impact of Risk Management on Industrial Productivity
|
Gender
|
|
|
Frequency
|
Percent
|
Valid Percent
|
Cumulative Percent
|
|
Valid
|
Male
|
69
|
86.3
|
86.3
|
86.3
|
|
Female
|
11
|
13.8
|
13.8
|
100.0
|
|
Total
|
80
|
100.0
|
100.0
|
|
Table 2: Frequency Table Gender
Figure 4: Results based on Gender
In the above
table, males represent 86.3% of the total population and females represent 13.8
% of the total population. However, the majority of male respondents can be
seen.
|
Age
|
|
|
Frequency
|
Percent
|
Valid Percent
|
Cumulative Percent
|
|
Valid
|
22 – 36 years
|
66
|
82.5
|
82.5
|
82.5
|
|
37 -55years
|
13
|
16.3
|
16.3
|
98.8
|
|
Over 55 years
|
1
|
1.3
|
1.3
|
100.0
|
|
Total
|
80
|
100.0
|
100.0
|
|
Table 3: Age
Figure 5: Results based on Age
In the above
table the age of the respondents is given, however, from the 80 respondents
82.5% were between 22 – 36 years, 16.3% were between 37 -55years and 1.3% were
over 55 years. The maximum number of respondents was between 22 – 36 years.
|
Educational Attainment of Impact of Risk Management on
Industrial Productivity
|
|
|
Frequency
|
Percent
|
Valid Percent
|
Cumulative Percent
|
|
Valid
|
Diploma
|
7
|
8.8
|
8.8
|
8.8
|
|
Bachelor
|
36
|
45.0
|
45.0
|
53.8
|
|
Master
|
37
|
46.3
|
46.3
|
100.0
|
|
Total
|
80
|
100.0
|
100.0
|
|
Table 4: Educational Attainment
Figure 6: Result based on Educational Attainment
|
In the above
table the education of the respondents is given, however, from the 80
respondents, the respondents did a diploma were 8.8%, the respondents did bachelor was 45.0%
and the respondents did master was 46.3%.
How long have you worked in the
company?
|
|
|
Frequency
|
Percent
|
Valid Percent
|
Cumulative Percent
|
|
Valid
|
Less than 2 years
|
9
|
11.3
|
11.3
|
11.3
|
|
2 – 5 years
|
36
|
45.0
|
45.0
|
56.3
|
|
6 – 15 years
|
34
|
42.5
|
42.5
|
98.8
|
|
Over 15 years
|
1
|
1.3
|
1.3
|
100.0
|
|
Total
|
80
|
100.0
|
100.0
|
|
Table 5: How long have you worked in the company?
Figure 7: Results based on people working in the company
In the above table, the working experience of
the respondents is given however, from the 80 respondents the respondents who
worked less than 2 years was 11.3%. the respondents who worked 2 – 5 years were
45.0%, the respondents who worked 6 – 15 years were 42.5% and the respondents
who worked over 15 years were 1.3%.
|
For
how long has this company been in operation?
|
|
|
Frequency
|
Percent
|
Valid Percent
|
Cumulative Percent
|
|
Valid
|
2 – 5 years
|
10
|
12.5
|
12.5
|
12.5
|
|
6 – 15 years
|
15
|
18.8
|
18.8
|
31.3
|
|
Over 15 years
|
50
|
62.5
|
62.5
|
93.8
|
|
5.00
|
5
|
6.3
|
6.3
|
100.0
|
|
Total
|
80
|
100.0
|
100.0
|
|
Table 6: For how long has this company been in
operation?
Figure 8: Results for operation information of
company
In the above
table the company operations in years by the respondents are given, however,
from the 80 respondents, the respondents told that the company is operating
between 2 – 5 years were 12.5%, the respondents told that company is operating
between 6 – 15 years was 18.8%. the respondents told that the company is
operating over 15 years were 62.5% and the respondents told that company is
operating from 5.00 years was 6.3%.
|
Does
the company have a risk management policy/ department?
|
|
|
Frequency
|
Percent
|
Valid Percent
|
Cumulative Percent
|
|
Valid
|
Yes
|
54
|
67.5
|
67.5
|
67.5
|
|
No
|
17
|
21.3
|
21.3
|
88.8
|
|
Maybe
|
9
|
11.3
|
11.3
|
100.0
|
|
Total
|
80
|
100.0
|
100.0
|
|
Table 7: Does the company have a risk management
policy/ department?

Figure 9: Information about company contain risk
management policy
In the above
table, the risk management policies of the company are discussed by the
respondents is given, however, from the 80 respondents, the respondents said
yes were 67.5%, the respondents said no were 21.3%, the respondents said maybe
were 11.3%.
|
How
often does the company review the risk policy?
|
|
|
Frequency
|
Percent
|
Valid Percent
|
Cumulative Percent
|
|
Valid
|
Quarterly
|
19
|
23.8
|
23.8
|
23.8
|
|
Semi-annually
|
18
|
22.5
|
22.5
|
46.3
|
|
Annually
|
24
|
30.0
|
30.0
|
76.3
|
|
Others
|
19
|
23.8
|
23.8
|
100.0
|
|
Total
|
80
|
100.0
|
100.0
|
|
Table 8: How often does the company review the risk
policy?

Figure 10: Results about reviewing risk policy of the
company
In the above
table, the company review the risk policy is noticed as from the 80
respondents, the respondents who said quarterly were 23.8%, the respondents who
said semi-annually were 22.5%. the respondents who said annually were 30.0% and
the respondents who said others were 23.8%.
|
Are
the employees in the company trained in implementing risk management policy
|
|
|
Frequency
|
Percent
|
Valid Percent
|
Cumulative Percent
|
|
Valid
|
Strongly agree
|
9
|
11.3
|
11.3
|
11.3
|
|
Agree
|
31
|
38.8
|
38.8
|
50.0
|
|
Undecided
|
21
|
26.3
|
26.3
|
76.3
|
|
Disagree
|
14
|
17.5
|
17.5
|
93.8
|
|
Strongly disagree
|
5
|
6.3
|
6.3
|
100.0
|
|
Total
|
80
|
100.0
|
100.0
|
|
Table 9: Are the employees in the company trained in
implementing risk management policy

Figure 11: Result about employee in the company are
trained for implement risk policy
In the above
table, the training on implementation regarding the risk policy is noticed as
from the 80 respondents, the respondents who strongly agree were 11.3%, the
respondents who agree were 38.8%, the respondents who undecided were 26.3%, the
respondents who disagree were 17.5%, however, the respondents who strongly
disagree were 6.3%.
|
What
factors do you consider when selecting the risk control methods to be used?"
|
|
|
Frequency
|
Percent
|
Valid Percent
|
Cumulative Percent
|
|
Valid
|
Statutory requirements
|
10
|
12.5
|
12.5
|
12.5
|
|
Cost of the risk control method
|
30
|
37.5
|
37.5
|
50.0
|
|
The estimated loss from the risk
|
23
|
28.7
|
28.7
|
78.8
|
|
Frequency of the risk occurring
|
17
|
21.3
|
21.3
|
100.0
|
|
Total
|
80
|
100.0
|
100.0
|
|
Table 10: What factors do you consider when selecting
the risk control methods to be used?"

Figure 12: Result about factors that are considered
for controlling risk
In the above
table, the factors that were considered by the respondent in order to control
the methods were focused as from the 80 respondents, the respondents who said
they focus on the statutory requirements were 12.5%. the respondents who said
they focus on the cost of the risk control method were 37.5%. the respondents
who said they focus on the estimated loss from the risk were 28.7% and the
respondents who said they focus on the frequency of the risk occurring were
21.3%.
|
What
kind of risk management techniques does the company use?
|
|
|
Frequency
|
Percent
|
Valid Percent
|
Cumulative Percent
|
|
Valid
|
Risk avoidance
|
42
|
52.5
|
52.5
|
52.5
|
|
Risk abatement
|
16
|
20.0
|
20.0
|
72.5
|
|
Risk allocation
|
17
|
21.3
|
21.3
|
93.8
|
|
Risk-retention
|
3
|
3.8
|
3.8
|
97.5
|
|
Other
|
2
|
2.5
|
2.5
|
100.0
|
|
Total
|
80
|
100.0
|
100.0
|
|
Table 11: What kind of risk management techniques
does the company use?

Figure 13: Results about techniques used for controlling
risk
In the above
table the kind of risk management techniques that company use was considered by
the respondent as from the 80 respondents, the respondents who said risk
avoidance was 52.5%, the respondents who said risk abatement were 20.0%. the
respondents who said risk allocation was 21.3%, the respondents who said risk
retention was 3.8%, the respondents who said others were 2.5%.
|
To
what extent have risks affecting
the performance of your company?
|
|
|
Frequency
|
Percent
|
Valid Percent
|
Cumulative Percent
|
|
Valid
|
Very great extent
|
18
|
22.5
|
22.5
|
22.5
|
|
Great extent
|
49
|
61.3
|
61.3
|
83.8
|
|
Small extent
|
12
|
15.0
|
15.0
|
98.8
|
|
Very small extent
|
1
|
1.3
|
1.3
|
100.0
|
|
Total
|
80
|
100.0
|
100.0
|
|
Table 12: risk affecting the performance of company

Figure 14: Result about affecting the performance of
company by risk
In the above
table, the risk extent that can affect company performance was considered by
the respondent as from the 80 respondents, the respondents who said very great
extent were 22.5%. the
respondents who said great extent was 61.3%. the respondents who said a small
extent were 15.0% and the respondents who said very small extent were 1.3%.
|
What
are the manufacturing standards
of your company?
|
|
|
Frequency
|
Percent
|
Valid Percent
|
Cumulative Percent
|
|
Valid
|
API
|
2
|
2.5
|
2.5
|
2.5
|
|
ASME
|
17
|
21.3
|
21.3
|
23.8
|
|
ASTM
|
7
|
8.8
|
8.8
|
32.5
|
|
ISO
|
49
|
61.3
|
61.3
|
93.8
|
|
Other
|
5
|
6.3
|
6.3
|
100.0
|
|
Total
|
80
|
100.0
|
100.0
|
|
Table 13: What are the manufacturing standards of
your company?

Figure 15: Results about manufacturing standards of a
company
In the above
table, the manufacturing standards of the company was considered by the respondent
as from the 80 respondents, the respondents who said API was 2.5%, the
respondents who said ASME were
21.3%. the respondents who said ASTM were 8.8%. the respondents who said ISO
was 61.3% and the respondents who said others were 6.3%.
|
What
is the average rate of
production levels or production targets?
|
|
|
Frequency
|
Percent
|
Valid Percent
|
Cumulative Percent
|
|
Valid
|
above average
|
30
|
37.5
|
37.5
|
37.5
|
|
average
|
45
|
56.3
|
56.3
|
93.8
|
|
bellow average
|
5
|
6.3
|
6.3
|
100.0
|
|
Total
|
80
|
100.0
|
100.0
|
|
Table 14: What is the average rate of production
levels or production targets?

Figure 16: Results about average rate of production
levels
In the above
table, the average rate of production level was considered by the respondent as
from the 80 respondents, the respondents who said above average were 37.5%, the
respondents who said average were 56.3% and the respondents who said below
average were 6.35%.
|
How
would you rate the number of risks faced by the company in terms of operational activities?
|
|
|
Frequency
|
Percent
|
Valid Percent
|
Cumulative Percent
|
|
Valid
|
Very high
|
24
|
30.0
|
30.0
|
30.0
|
|
High
|
31
|
38.8
|
38.8
|
68.8
|
|
Fair
|
19
|
23.8
|
23.8
|
92.5
|
|
Low
|
6
|
7.5
|
7.5
|
100.0
|
|
Total
|
80
|
100.0
|
100.0
|
|
Table 15: How would you rate the number of risks
faced by the company in terms of operational activities?

Figure 17: Results about how many company faced risks
due to operational activities
In the above
table, the number of risks faced by the company in terms of operational
activities was considered by the respondent as from the 80 respondents, the
respondents who said very high were 30.0%. the respondents who said high 38.8%,
the respondents who said fair were 23.8%, the respondents who said low were
7.5%.
Regression
|
Descriptive
Statistics
|
|
|
Mean
|
Std. Deviation
|
N
|
|
DV
|
2.4167
|
.53170
|
80
|
|
IV
|
2.6400
|
.62796
|
80
|
Table 16: Descriptive Statistics
|
Correlations
|
|
|
DV
|
IV
|
|
Pearson Correlation
|
DV
|
1.000
|
.407
|
|
IV
|
.407
|
1.000
|
|
Sig. (1-tailed)
|
DV
|
.
|
.000
|
|
IV
|
.000
|
.
|
|
N
|
DV
|
80
|
80
|
|
IV
|
80
|
80
|
Table 17: Correlations
|
Variables
Entered/Removed
|
|
Model
|
Variables Entered
|
Variables Removed
|
Method
|
|
1
|
IVb
|
.
|
Enter
|
Table 18: Variables Entered/Removed
|
a. Dependent
Variable: DV
|
|
b. All requested variables entered.
|
|
Model
Summary
|
|
Model
|
R
|
R Square
|
Adjusted R Square
|
Std. The error of the Estimate
|
|
1
|
.407a
|
.166
|
.155
|
.48879
|
Table 19: Model Summary
|
a.
Predictors: (Constant), IV
|
Multiple linear regression analysis is performed on
the dependent variable and independent variable, so that there could be a
better analysis of the association between variables thus, regarding the model
summary regression tables, the values of the R, Durbin-Watson,
adjusted R square, std. the error of the estimate and R square, and are given.
The value of the std. the error of the estimate is 48879 the values of adjusted
R square is .155 and the value of R is. 407; the value of r square is .166, it could
be analyzed after conducting the result that there is a simple correlation
between the dependent as well as the independent variables. Independent
variables have more than 50% percent of the impact dependent variables because
R Square values are near 0.5 after considering the multiple regressions that
regression line has the 100% variability of the responses.
ANOVA
|
|
Model
|
Sum of Squares
|
df
|
Mean Square
|
F
|
Sig.
|
|
1
|
Regression
|
3.698
|
1
|
3.698
|
15.479
|
.000b
|
|
Residual
|
18.635
|
78
|
.239
|
|
|
|
Total
|
22.333
|
79
|
|
|
|
Table 20: ANOVA
|
a. Dependent
Variable: DV
|
|
b. Predictors: (Constant), IV
|
In the table of ANOVA, the measurable system is
concerned so that there could be better evaluation of the scale-dependent
variables. However, in the table, the evaluation is
done on the potential contrast so that there could be better evaluation of the
two variable classifications. It could be analyzed that after conducting the
Anova test that independent variables and dependent variables have significant
relationships and there are also statistically significant differences.
Moreover, considering the above-given table, it is known that F between the
groups is 15.479; thus the mean square is 3.698, in this way, it could be known
that the model is a good fit. There is P 0.000 which is 0.05, it means the
variables have a significant value. Though, it means that there is a positive
significant relationship in the dependent as well as the independent variables.
|
Coefficients of Impact of Risk Management on
Industrial Productivity
|
|
Model
|
Unstandardized Coefficients
|
Standardized Coefficients
|
t
|
Sig.
|
|
B
|
Std. Error
|
Beta
|
|
1
|
(Constant)
|
1.507
|
.238
|
|
6.344
|
.000
|
|
IV
|
.345
|
.088
|
.407
|
3.934
|
.000
|
Table 21: Coefficients
|
Coefficients
|
|
Model
|
95.0% Confidence Interval for B
|
|
Lower Bound
|
Upper Bound
|
|
1
|
(Constant)
|
1.034
|
1.980
|
|
IV
|
.170
|
.519
|
|
a. Dependent Variable: DV
|
Correlations
of Impact of Risk Management on Industrial Productivity
|
Descriptive
Statistics
|
|
|
Mean
|
Std. Deviation
|
N
|
|
IV
|
2.6400
|
.62796
|
80
|
|
DV
|
2.4167
|
.53170
|
80
|
Table 22: Dependent Variable: DV descriptive
statistics
|
Correlations
|
|
|
IV
|
DV
|
|
IV
|
Pearson Correlation
|
1
|
.407**
|
|
Sig. (2-tailed)
|
|
.000
|
|
N
|
80
|
80
|
|
DV
|
Pearson Correlation
|
.407**
|
1
|
|
Sig. (2-tailed)
|
.000
|
|
|
N
|
80
|
80
|
Table 23: Dependent Variable: DV
|
Descriptives
a,b,c,d
|
|
|
IV
|
Statistic
|
Std. Error
|
|
DV
|
1.40
|
Mean
|
1.6667
|
.33333
|
|
95% Confidence Interval for Mean
|
Lower Bound
|
-2.5687
|
|
|
Upper Bound
|
5.9021
|
|
|
5% Trimmed Mean
|
.
|
|
|
Median
|
1.6667
|
|
|
Variance
|
.222
|
|
|
Std. Deviation
|
.47140
|
|
|
Minimum
|
1.33
|
|
|
Maximum
|
2.00
|
|
|
Range
|
.67
|
|
|
Interquartile Range
|
.
|
|
|
Skewness
|
.
|
.
|
|
Kurtosis
|
.
|
.
|
|
1.60
|
Mean
|
1.6667
|
.33333
|
|
95% Confidence Interval for Mean
|
Lower Bound
|
-2.5687
|
|
|
Upper Bound
|
5.9021
|
|
|
5% Trimmed Mean
|
.
|
|
|
Median
|
1.6667
|
|
|
Variance
|
.222
|
|
|
Std. Deviation
|
.47140
|
|
|
Minimum
|
1.33
|
|
|
Maximum
|
2.00
|
|
|
Range
|
.67
|
|
|
Interquartile Range
|
.
|
|
|
Skewness
|
.
|
.
|
|
Kurtosis
|
.
|
.
|
|
2.00
|
Mean
|
2.5238
|
.28966
|
|
95% Confidence Interval for Mean
|
Lower Bound
|
1.8150
|
|
|
Upper Bound
|
3.2326
|
|
|
5% Trimmed Mean
|
2.5450
|
|
|
Median
|
3.0000
|
|
|
Variance
|
.587
|
|
|
Std. Deviation
|
.76636
|
|
|
Minimum
|
1.33
|
|
|
Maximum
|
3.33
|
|
|
Range
|
2.00
|
|
|
Interquartile Range
|
1.33
|
|
|
Skewness
|
-.762
|
.794
|
|
Kurtosis
|
-1.161
|
1.587
|
|
2.20
|
Mean
|
2.2424
|
.13552
|
|
95% Confidence Interval for Mean
|
Lower Bound
|
1.9405
|
|
|
Upper Bound
|
2.5444
|
|
|
5% Trimmed Mean
|
2.2694
|
|
|
Median
|
2.3333
|
|
|
Variance
|
.202
|
|
|
Std. Deviation
|
.44947
|
|
|
Minimum
|
1.33
|
|
|
Maximum
|
2.67
|
|
|
Range
|
1.33
|
|
|
Interquartile Range
|
.67
|
|
|
Skewness
|
-.892
|
.661
|
|
Kurtosis
|
.009
|
1.279
|
|
2.40
|
Mean
|
2.2593
|
.13354
|
|
95% Confidence Interval for Mean
|
Lower Bound
|
1.9513
|
|
|
Upper Bound
|
2.5672
|
|
|
5% Trimmed Mean
|
2.2510
|
|
|
Median
|
2.3333
|
|
|
Variance
|
.160
|
|
|
Std. Deviation
|
.40062
|
|
|
Minimum
|
1.67
|
|
|
Maximum
|
3.00
|
|
|
Range
|
1.33
|
|
|
Interquartile Range
|
.50
|
|
|
Skewness
|
.537
|
.717
|
|
Kurtosis
|
.270
|
1.400
|
|
2.60
|
Mean
|
2.2424
|
.13552
|
|
95% Confidence Interval for Mean
|
Lower Bound
|
1.9405
|
|
|
Upper Bound
|
2.5444
|
|
|
5% Trimmed Mean
|
2.2323
|
|
|
Median
|
2.0000
|
|
|
Variance
|
.202
|
|
|
Std. Deviation
|
.44947
|
|
|
Minimum
|
1.67
|
|
|
Maximum
|
3.00
|
|
|
Range
|
1.33
|
|
|
Interquartile Range
|
.67
|
|
|
Skewness
|
.304
|
.661
|
|
Kurtosis
|
-1.201
|
1.279
|
|
2.80
|
Mean
|
2.4444
|
.13608
|
|
95% Confidence Interval for Mean
|
Lower Bound
|
2.1306
|
|
|
Upper Bound
|
2.7583
|
|
|
5% Trimmed Mean
|
2.4383
|
|
|
Median
|
2.3333
|
|
|
Variance
|
.167
|
|
|
Std. Deviation
|
.40825
|
|
|
Minimum
|
2.00
|
|
|
Maximum
|
3.00
|
|
|
Range
|
1.00
|
|
|
Interquartile Range
|
.83
|
|
|
Skewness
|
.233
|
.717
|
|
Kurtosis
|
-1.556
|
1.400
|
|
3.00
|
Mean
|
2.6944
|
.13889
|
|
95% Confidence Interval for Mean
|
Lower Bound
|
2.3888
|
|
|
Upper Bound
|
3.0001
|
|
|
5% Trimmed Mean
|
2.6790
|
|
|
Median
|
2.6667
|
|
|
Variance
|
.231
|
|
|
Std. Deviation
|
.48113
|
|
|
Minimum
|
2.00
|
|
|
Maximum
|
3.67
|
|
|
Range
|
1.67
|
|
|
Interquartile Range
|
.67
|
|
|
Skewness
|
.699
|
.637
|
|
Kurtosis
|
.019
|
1.232
|
|
3.20
|
Mean
|
2.5000
|
.50000
|
|
95% Confidence Interval for Mean
|
Lower Bound
|
-3.8531
|
|
|
Upper Bound
|
8.8531
|
|
|
5% Trimmed Mean
|
.
|
|
|
Median
|
2.5000
|
|
|
Variance
|
.500
|
|
|
Std. Deviation
|
.70711
|
|
|
Minimum
|
2.00
|
|
|
Maximum
|
3.00
|
|
|
Range
|
1.00
|
|
|
Interquartile Range
|
.
|
|
|
Skewness
|
.
|
.
|
|
Kurtosis
|
.
|
.
|
|
3.40
|
Mean
|
2.9167
|
.28464
|
|
95% Confidence Interval for Mean
|
Lower Bound
|
2.0108
|
|
|
Upper Bound
|
3.8225
|
|
|
5% Trimmed Mean
|
2.9074
|
|
|
Median
|
2.8333
|
|
|
Variance
|
.324
|
|
|
Std. Deviation
|
.56928
|
|
|
Minimum
|
2.33
|
|
|
Maximum
|
3.67
|
|
|
Range
|
1.33
|
|
|
Interquartile Range
|
1.08
|
|
|
Skewness
|
.753
|
1.014
|
|
Kurtosis
|
.343
|
2.619
|
|
3.60
|
Mean
|
2.7778
|
.11111
|
|
95% Confidence Interval for Mean
|
Lower Bound
|
2.2997
|
|
|
Upper Bound
|
3.2559
|
|
|
5% Trimmed Mean
|
.
|
|
|
Median
|
2.6667
|
|
|
Variance
|
.037
|
|
|
Std. Deviation
|
.19245
|
|
|
Minimum
|
2.67
|
|
|
Maximum
|
3.00
|
|
|
Range
|
.33
|
|
|
Interquartile Range
|
.
|
|
|
Skewness
|
1.732
|
1.225
|
|
Kurtosis
|
.
|
.
|
|
3.80
|
Mean
|
2.8333
|
.16667
|
|
95% Confidence Interval for Mean
|
Lower Bound
|
.7156
|
|
|
Upper Bound
|
4.9510
|
|
|
5% Trimmed Mean
|
.
|
|
|
Median
|
2.8333
|
|
|
Variance
|
.056
|
|
|
Std. Deviation
|
.23570
|
|
|
Minimum
|
2.67
|
|
|
Maximum
|
3.00
|
|
|
Range
|
.33
|
|
|
Interquartile Range
|
.
|
|
|
Skewness
|
.
|
.
|
|
Kurtosis
|
.
|
.
|
Table 24: Descriptives a,b,c,d
In order to
check the correlation between variables, the Pearson correlation test is
performed so that there could be an analysis of the dependent variables and the
independent variable. However, it is noted that there is a positive influence
on the independent variable.
Statistics
|
|
|
Gender
|
Age
|
Educational Attainment
|
How long have you worked in the
company?
|
For how long has this company been in
operation?
|
|
N
|
Valid
|
80
|
80
|
80
|
80
|
80
|
|
Missing
|
0
|
0
|
0
|
0
|
0
|
|
Mean
|
1.1375
|
2.1875
|
2.3750
|
2.3375
|
2.6875
|
|
Median
|
1.0000
|
2.0000
|
2.0000
|
2.0000
|
3.0000
|
|
Mode
|
1.00
|
2.00
|
3.00
|
2.00
|
3.00
|
|
Std. Deviation
|
.34655
|
.42378
|
.64386
|
.69252
|
.92221
|
|
Variance
|
.120
|
.180
|
.415
|
.480
|
.850
|
Table 25: Statistics
|
Statistics
|
|
|
Does the company have a risk management
policy/ department?
|
How often does the company review the
risk policy?
|
Are the employees in the company
trained on implementing of risk management policy
|
What factors do you consider when
selecting the risk control methods to be used?"
|
What kind of risk management techniques
does the company use?
|
|
N
|
Valid
|
80
|
80
|
80
|
80
|
80
|
|
Missing
|
0
|
0
|
0
|
0
|
0
|
|
Mean
|
1.4375
|
2.5375
|
2.6875
|
2.5875
|
1.8375
|
|
Median
|
1.0000
|
3.0000
|
2.5000
|
2.5000
|
1.0000
|
|
Mode
|
1.00
|
3.00
|
2.00
|
2.00
|
1.00
|
|
Std. Deviation
|
.69069
|
1.10171
|
1.08609
|
.96382
|
1.04873
|
|
Variance
|
.477
|
1.214
|
1.180
|
.929
|
1.100
|
|
Statistics
|
|
|
To what extent have risks affecting the
performance of your company?
|
What are the manufacturing standards of
your company?
|
What is the average rate of production
levels or production targets?
|
How would you rate the number of risks
faced by the company in terms of operational activities?
|
IV
|
|
N
|
Valid
|
80
|
80
|
80
|
80
|
80
|
|
Missing
|
0
|
0
|
0
|
0
|
0
|
|
Mean
|
2.1125
|
3.4750
|
1.6875
|
2.0875
|
2.6400
|
|
Median
|
2.0000
|
4.0000
|
2.0000
|
2.0000
|
2.6000
|
|
Mode
|
2.00
|
4.00
|
2.00
|
2.00
|
3.00
|
|
Std. Deviation
|
.96776
|
.98051
|
.58664
|
.91671
|
.62796
|
|
Variance
|
.937
|
.961
|
.344
|
.840
|
.394
|
|
Statistics
|
|
|
DV
|
|
N
|
Valid
|
80
|
|
Missing
|
0
|
|
Mean
|
2.4167
|
|
Median
|
2.3333
|
|
Mode
|
2.67
|
|
Std. Deviation
|
.53170
|
|
Variance
|
.283
|
Secondary data of
Impact of Risk Management on Industrial Productivity
The secondary data is based on the
information extracted from journal articles and books. According to the
research findings of Mili, Bassetto, Siadat, and Tollenaere (2009), risk
analysis and management increase organizational productivity for the companies
working in the services and manufacturing sector. Hazard identification and
management system employed in the organization reduce the risk factor for the
financial outcomes and productivity of the organization as it results in the
improvement of operations. Organizations having proper risk management system
can identify risk factor in the organization in advance. As a result of these
organizations can develop appropriate mitigation strategies in advance thus negative
impact risk factors can be avoided. (Mili, Bassetto, Siadat, & Tollenaere,
2009)
Summarizing the research findings
of Halachmi (2005), public risk of financial constraints have a negative impact
on the governance system which is unwanted for the successful operations of an
organization. Following research findings, overall productivity gets influence
in a negative way if risk factors are not managed appropriately. Moreover,
researchers claim that good governance supports proper risk mitigation strategies
to bring forward the productivity and efficiency of an organization (Halachmi,
2005).
According to the book written on
risk management strategies and organizational productivity, productivity is the
main requirement of an organization. Productivity of employees performance and
resources utilization provide monetary and non-monetary benefits to an
organization. Considering the impact of a risk management system in several
organizations it is concluded that risk management is a favourable action for
organizational productivity (Segal,
2011).
Another book is written on the
geotechnical risk management in construction sector state that construction
projects involve several risk factors which can cause delays and excessive
wastes. Delays and excessive wastes are critical for the successful completion
of a construction project. Moreover, such risk factors can negatively change
the reputation of an organization. Somehow, focusing on the productivity
requirement writer concluded that a successful strategy for the control and
management of identified geotechnical risk have a positive impact on
organizational productivity. Managed risk enables the workforce to outperform
in the organization as risk factors and conflicts associated with risks are
eliminated from the organization.
(Clayton, 2001 )
Consequently, it can be said that
secondary data analyzed on the identified research topic is supportive for the
research findings of primary data. Secondary and primary both type of research
data collected on the research topic concludes that organizations need to
control their risk factors linked with external and internal environments to
reach the target of productivity in the organization.

Figure 18: Secondary data about risk faced by company
during operations

Figure 19: Secondary data about average rate of
production
Chapter 5. Discussion and Conclusion of Impact
of Risk Management on Industrial Productivity
References of Impact of Risk Management on
Industrial Productivity
Ahlemann, F. (2009). Towards a conceptual reference
model for project management information systems. International Journal of
Project Management, 27(1), 19–30. doi:10.1016/j.ijproman.2008.01.008
Ajayi, V. O. (2017). Primary sources of
data and secondary sources of data; Distinguish between primary sources of data
and secondary sources of data.
Almeida, H. K. (2017). Risk management
with supply contracts. The Review of Financial Studies , 4179-4215.
Andersen, T. J. (2019). Strategic Risk
Management: A Research Overview. Routledge.
Caldwell, B. (2015). Beyond positivism.
. Routledge.
Clayton, C. (2001 ). Managing
geotechnical risk: improving productivity in UK building and construction.
thomas telford.
Colton, D. &. (2007). Designing and
constructing instruments for social research and evaluation. . John Wiley
& Sons.
Cornaggia, J. (2009). Does Risk
Management Improve Productivity?Evidence from the U.S. Agricultural Industry.
US: Evidence from the U.S. Agricultural Industry. Retrieved from
https://pdfs.semanticscholar.org/5d0b/e8536d9a7289dcf33d9393e567d1ab722faa.pdf
Coronado, et al, A. (2014). Healthcare
Cybersecurity Risk Management: Keys To an Effective Plan. Biomedical Instrumentation
& Technology, 48(1), 26–30. doi:10.2345/0899-8205-48.s1.26
Fan et al , C. (2012). The Risk Management
Strategy of Applying Cloud Computing. International Journal of Advanced
Computer Science and Applications, 3(9).
Flippingheck.Com. (2019, March 19). Improve
Your Productivity With Risk Management. Retrieved from
https://www.flippingheck.com/improve-your-productivity-with-risk-management/
Georgiadis, A., & Pitelis, C. N.
(2016). The impact of employees' and managers' training on the performance of
small‐and medium‐sized enterprises: Evidence from a randomized natural
experiment in the UK service sector. British Journal of Industrial
Relations, 54(2), 409-421.
Grover, V. K. (2015). Research approach:
An overview. Golden Research Thoughts, 4(8), 1-8.
Halachmi, A. (2005). Governance and risk
management: challenges and public productivity. International Journal of
Public Sector Management.
Harrell, M. C. (2009). Data collection
methods. Semi-structured interviews and focus groups. Rand National Defense
Research Inst santa monica ca.
Hill, S. A. (2010). Idea sets:
Conceptualizing and measuring a new unit of analysis in entrepreneurship
research. . Organizational research methods, , 13(1), 85-113.
Krizman, A. (2011). Methodolgy in
research: how to assure reliability and validity of constructions in logistics
research. Transport Problems, , 6, 51-58.
Lannelongue, G. J.-B. (2017).
Environmental management and labour productivity: The moderating role of
capital intensity. Journal of environmental management , 158-169.
Malik, A. a. (2019). "Risk and Its
Mitigation Techniques. In Introduction to Takaful, 45-51.
Marucco, F. B. (2011). Bridging the gaps
between non-invasive genetic sampling and population parameter estimation. European
Journal of Wildlife Research,, 57(1), 1-13.
Mili, A., Bassetto, S., Siadat, A., &
Tollenaere, M. (2009). Dynamic risk management unveil productivity
improvements. Journal of Loss Prevention in the Process Industries, 22(1),
25-34.
Naji, H. I. (2019). Risk Management
Techniques. In Strategic Management-a Dynamic View.
Okibo, B. a. (2014). Effects of E-Banking
on Growth of Customer Base in Kenyan Banks. . International Journal of
Research in Management and Business Studies, 1(1), 78-84.
Picci, L. A. (2019). A Decision Tool for
Quality System Improvemen. In 2019 IEEE International Conference on
Industrial Engineering and Engineering Management , 405-410.
Rejda, G. (2011). Principles of Risk
Management and Insurance. Pearson Education India, .
Romero, D. S.-B. (2018). Digitalizing
occupational health, safety and productivity for the operator 4.0. In IFIP
International Conference on Advances in Production Management Systems,
473-481.
Sabri Boubaker, B. B. (2016). Risk
Management in Emerging Markets: Issues, Framework, and Modeling. Emerald
Group Publishing, 2016.
Sadgrove, K. (2016). he complete guide to
business risk management. Routledge.
Salau, A. (2019, Novemeber 17). 10
Components of Risk Management Plan. Retrieved from https://crmnigeria.com/10-components-of-risk-management-plan/
Saleem, S. (2018). Do effective risk
management affect organizational performance. European Journal of Business
and Management , 3(3), 258-267.
Sarji, M. (2017). Information Technology
and its Influence on the Lebanese Banking Sector. IOSR Journal of Business
and Management, 19(4), 19-28.
Saunders, M. L. (2009). Understanding
research philosophies and approaches. Research methods for business
students,, 4(106-135).
Segal, S. (2011). Corporate Value of
Enterprise Risk Management: The Next Step in Business Management. John
Wiley & Sons.
Siam, A. ( 2006). Role of the Electronic
Banking Services on the Profits of Jordanian Banks. American Journal of
Applied Sciences, , 3(9), 1999-2004.
Sinha, J. &. (2013). How time horizon
perceptions and relationship deficits affect impulsive consumption. Journal
of Marketing Research,, 50(5), 590-605.
Taherdoost, H. (2016). Sampling methods
in research methodology; how to choose a sampling technique for research. How
to Choose a Sampling Technique for Research (April 10, 2016).
Takabi, H., & et.al. (2010). Security
and Privacy Challenges in Cloud Computing Environments. IEEE Security &
Privacy Magazine,, 6(3), 24-31.
Tupa, J. J. (2017). Aspects of risk
management implementation for Industry. Procedia Manufacturing ,
1223-1230.
van Winsen, F. Y. (2016). Determinants of
risk behaviour: effects of perceived risks and risk attitude on farmer’s
adoption of risk management strategies. Journal of Risk Research ,
56-78.
Villa, V. P. (2016). owards dynamic risk
analysis: A review of the risk assessment approach and its limitations in the
chemical process industry. Safety science 89, 77-93.
VTT, W. (2017, 10 16). Are you using
risk management to improve your productivity? Retrieved from
https://vttblog.com/2017/10/16/risk-management-to-improve-productivity/
Wilson, J. (2010). “Essentials of
Business Research: A Guide to Doing Your Research Project” . SAGE
Publications, p.7.
Yakemovic , K. B. (2000). Report on a Development
Project Use of an Issue-Based Information System. CSCW 90 Proceedings.
Retrieved from http://sci-hub.tw/https://dl.acm.org/citation.cfm?id=99347
Zalk, D. M. (2018). 522 Qualitative risk
management techniques in emergency preparedness and response to identify and
reduce occupational risk factors. springer, A117-A118.


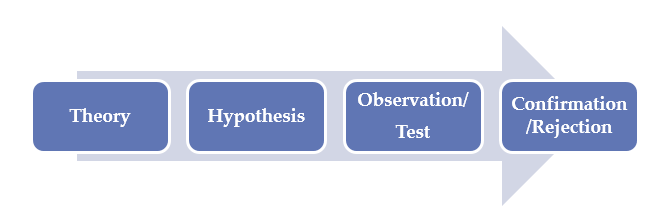